Lecture 6: Missing and weird data
HTML Slides
 │ PDF Slides
 │ Demo code on GitHub

Topic overview#
- What to do with missing data
- Detecting and handling outliers
Resources used:
- Feature Engineering Chapter 8
- Hands on Machine Learning with Scikit-Learn and Tensorflow/PyTorch, Chapter 2. Available at MRU Library
- Scikit-learn user guide: Chapters 2 and 7
The problem#
- As you’ve seen, real-world data is messy
- Missing values are common, other values don’t make sense
- We need to decide how to deal with these problems
What examples have we seen so far? Why might data be missing or weird*?
*I’m using “weird” as an informal catch-all for unexpected or outlier values
Missing data#
When data are missing in the features we have a few options:
- Do nothing! Some algorithms (e.g. Decisions Trees) can handle missing values
- Remove features with missing values
- Remove samples with missing values
- Invent a new value to represent “missingness”
- Impute a value based on other data
Most important: understand why data are missing (more EDA!)
Option 1: removing features#
- If a feature has:
- A high proportion of missing values, and
- Little apparent relationship to the target or
- its information is redundant with other features
- It may be reasonable to remove it entirely. You can drop it, e.g.:or (probably more reliable) just not select it when building your pipeline
df.drop(columns=['feature_name'], inplace=True)
Option 2: removing samples#
- If only a small number of samples have missing values, you can drop them from the training data:
train.dropna(subset=[["features","we","care","about"]], inplace=True) - Good idea if the same samples have missing values from multiple features
- Still useful to explore why data are missing
What should we do for inference?
Option 3: invent a new value#
- Categorical features: add a new category for “missing”
- Add a new binary feature indicating whether the value was missing
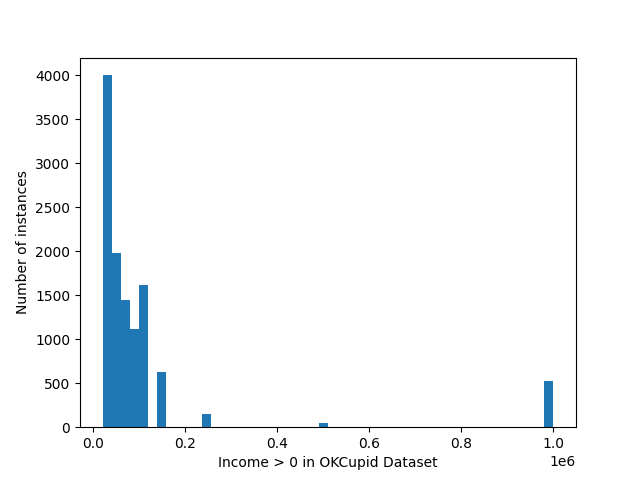
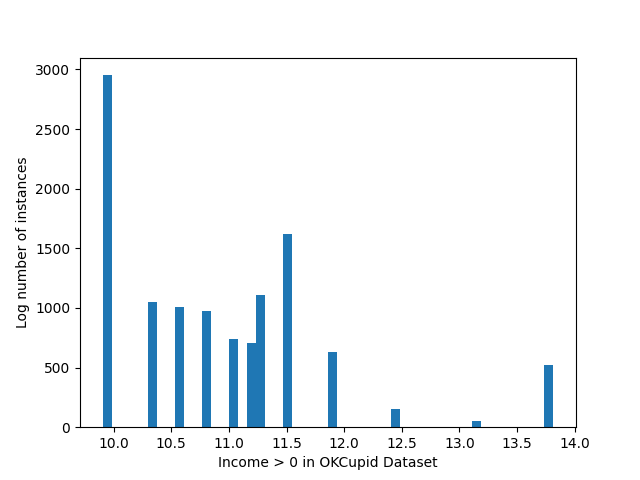
- I have seen advice to use extreme values for numerical features, like the -1 income in the OKCupid dataset, but I’m not convinced this is a good idea
Case study: where missingness is informative
Option 4: impute missing values#
- Fill in the missing values with an “educated guess”
- Replace missing value with:
- constant
- mean, median, or mode (
most_frequent)
- Use other features to infer missing value:
- K-nearest neighbours
- simple models to predict missing values
- Can be combined with option 3 to indicate missing features
- How much to impute? Feat.Engineering suggests no more than 20%
Choosing an imputation strategy#
| Strategy | When to use |
|---|---|
| Constant | When there is a reasonable default value |
| Mean | Numeric features with normal distribution |
| Median | Numeric features with extreme outliers |
| KNN | Relationship with other features |
| Missingness indicator | If missingness seems informative |
Outliers#
An outlier is an observation which deviates so much from the other observations as to arouse suspicions that it was generated by a different mechanism. – D. M. Hawkins
- There are many entire books dedicated to outlier detection
- Useful for anomaly detection, e.g:
- fraud detection
- failure prediction
- Many other applications
- Our focus is on dealing with outliers in preprocessing
Where we left off on February 5#
Detecting outliers#
- Visually as part of EDA
- Statistically, e.g. $\gt 3\sigma$
- Algorithmically, e.g. Isolation Forests
- As usual, context and domain knowledge are essential
Context matters!#
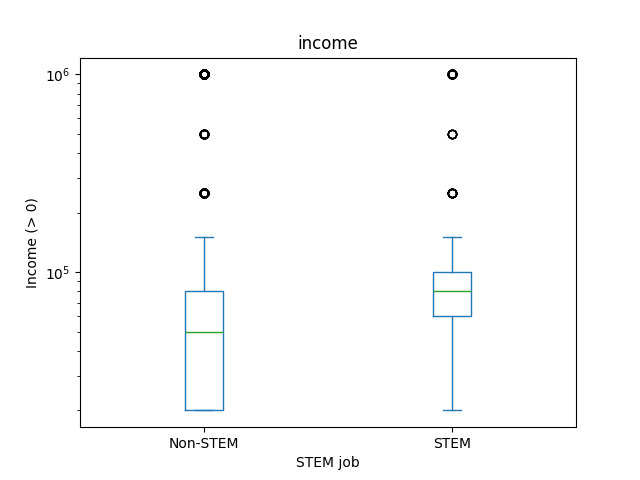
- Look at the relationship between outliers and target (training dataset, of course)
What do the dots on box plots represent?
What to do about outliers?#
- Data transformations
- Drop the samples
- Encode them somehow
- Leave them alone
As usual, very data- and model-dependent. Tree based methods are particularly impacted by outliers!
Any other ideas?
Nonlinear transformations#
- Transforming the data does not actually remove the outlier
- Can help make the relationship less extreme
Dropping the samples#
- In general, not a thing I love to do
- If you drop a sample from training, you need to decide what to do at inference
- My opinion: Only do it if you’re confident it’s an error in the dataset
Can you think of an example?
- What can you do at inference time when outliers are encountered?
Encoding outliers#
A few other options that might fall into “encoding”:
- Just like with missing values, binary column indicating outlier/inlier
- Remove the values and convert them to missing
- Bin or impose a cap (floor/ceiling) on the value
- Replace the numeric value with a rank or quantile bucket
- Probably other things!
Leave them alone#
If your outliers are:
- Real values (not data entry or other errors)
- Representative of things that might happen during inference
Then you probably want to keep them!
Consider using a RobustScalar to standardize if you have lots of outliers
Missing values and outliers in the target#
- If you have missing values in the target, you probably want to avoid imputing
- This is a good case for dropping samples from training!
- Outliers are trickier – again, check if they’re real or mistakes
- There may be a case for transforming the target
Coming up next#
- Interactions between variables
- Feature selection
- Midterm stuff
- Reading week!!!!